Reporting and Dashboards
Our reporting module lets you create customized dashboards, tailored to your specific needs.
You can adjust formulas, presentation and vocabulary, while configuring the indicators you want to track in detail.

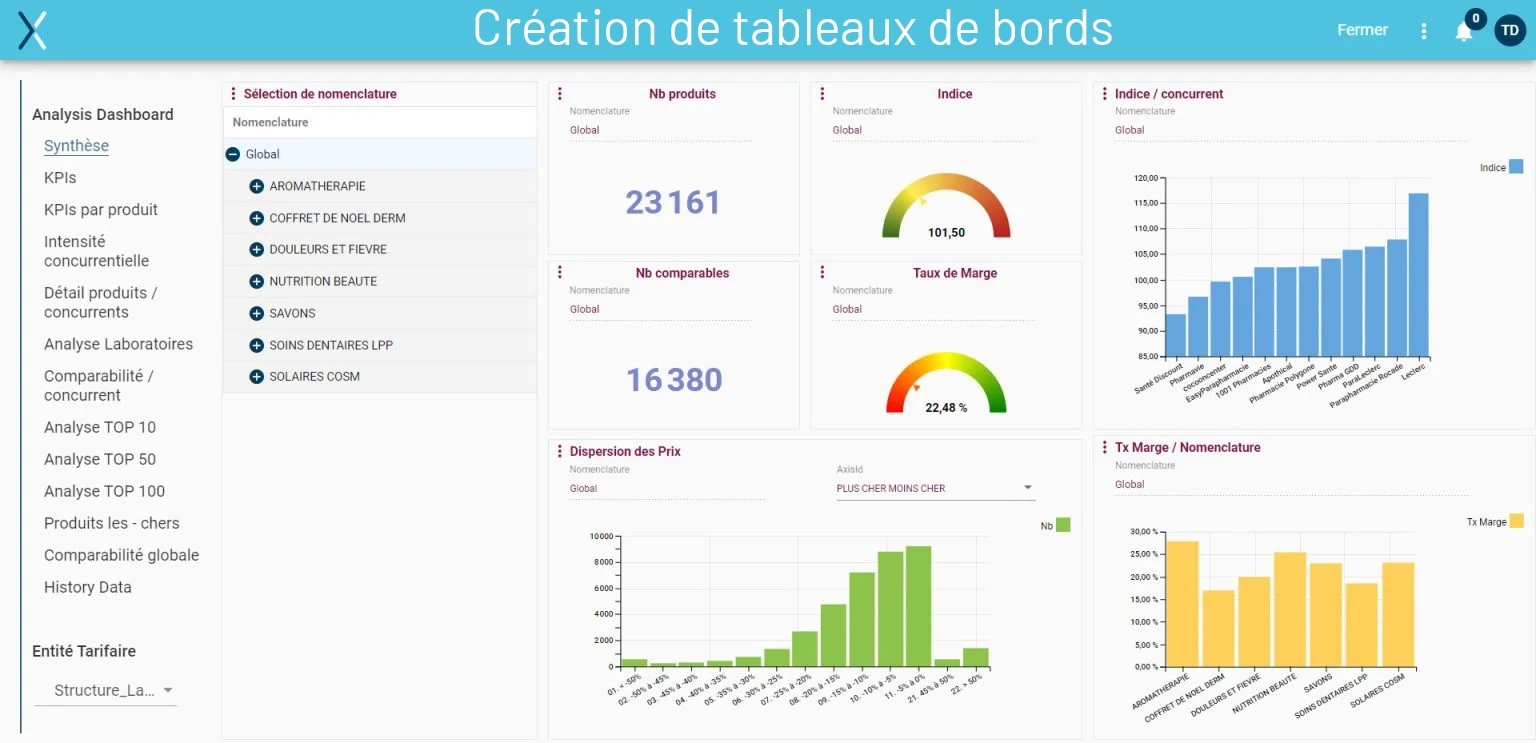
Creation of customizable dashboards
Thanks to our reporting module, you can create customized dashboards according to your specific needs.
This includes the ability to customize formulas, shapes and vocabulary used. Also adjust the dashboards according to the indicators you want to monitor closely.
Smooth integration with BI tools
Our solution is designed for seamless integration with third-party Business Intelligence tools. You can import a wealth of data from external sources.
For example, you can import data such as internally calculated elasticity coefficients, product attributes, and product sheets. But also information on VAT and taxes.
Enrich your reports with relevant data from different sources and get a more complete view of your pricing activities.

*6 months after deployment in 45 stores.
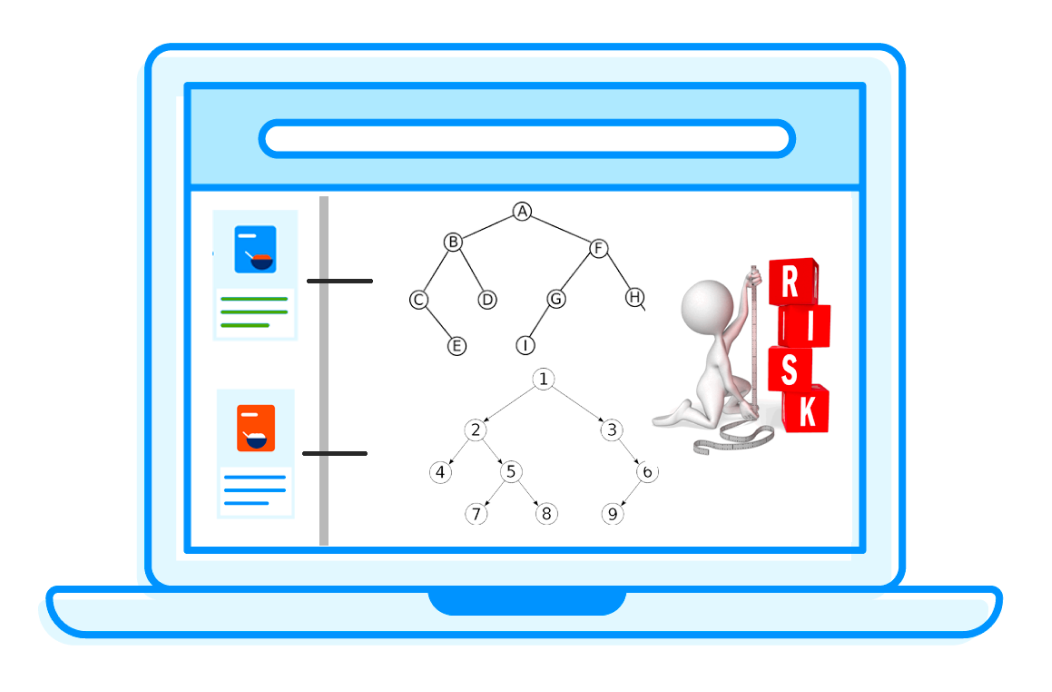
Share your data
Our reporting module enables you to generate reports that can be shared with different people within your company. For example, pricing teams, category managers, marketing, IT, and management.
This promotes transparent communication and effective collaboration. Sharing provides everyone with relevant information to make informed decisions.
Easy data export
You caneasily export your data to Excel files or PDF reports.
Share and analyze data in greater depth, using other tools or presenting it to key stakeholders.
Customer testimonials
« Optimix XPA is a very interesting tool. It has already allowed me to identify and correct pricing anomalies shortly after taking over my new store in Nice. I have just discovered that I can automate the generation of my analysis projects. I can't wait to use it for my other local stores. »
« Optimix is a highly effective pricing tool that enables us to adapt our pricing to our competitive context and margin objectives. Optimix offers the option to work at the item, category, or even based on national top sales, either individually or simultaneously, as well as on private label products, national brands, and regional products. »
« With the Optimix XPA solution, Bureau Vallée reduced errors, optimized competitive analysis (BtoB/BtoC) and refined planogram preparation, thus gaining in productivity. In 9 months, the ROI was achieved: the business teams halved their alignment time, linking over 12,000 products in 3 minutes. A real performance driver for the retailer. »

« Optimix significantly improved our pricing management, enabling smoother operations and faster implementation without issues. The solution adapts to our evolving needs, thanks to continuous development and tailored functionalities. The implementation process was seamless, with exceptional support: rapid responses, quick issue resolution, and a deep understanding of business needs. Optimix has proven to be an invaluable partner in optimizing our processes. »

« Optimix XPA has transformed our pricing strategy thanks to precise analyses and enhanced responsiveness. Change management support was key, with effective team training for rapid adoption. The result: significant time savings on time-consuming tasks, enabling teams to concentrate on high value-added actions. »

Reportings & Dashboards
FAQ 1: What types of data can I import into Optimix XPA dashboards?
In Optimix XPA’s dashboards, a multitude of data can be imported to enrich your reports and provide a complete view of your pricing activities. Thanks to seamless integration with Business Intelligence tools, you can integrate data from external sources into Optimix XPA’s reporting module.
For example, it is possible to import internally calculated elasticity coefficients, product attributes, product sheets, as well as information relating to VAT and taxes, among others.
These imports provide personalized, information-rich dashboards, promoting better decision-making based on concrete and relevant data.
FAQ 2: How can I export the generated reports, in what format and how often?
You can export the generated reports in various formats such as Excel files or PDF reports. What’s more, you can export at any time, according to your needs.
Optimix XPA’s reporting module makes it easy to export data and results from your dashboards. You can easily export this data in a variety of formats, including Excel files and PDF reports. This flexibility allows easy manipulation and analysis of data according to your needs. Additionally, the automated reporting feature allows you to generate reports automatically on a schedule that you define.
This facilitates continuous monitoring of your key performance indicators (KPIs) and regular tracking of performance trends. So whether you’re looking for a one-off or periodic export, Optimix XPA has the tools to meet your needs.
FAQ 3 : What key indicators are generally tracked in retail pricing dashboards?
In retail, pricing reports are essential for monitoring and analyzing key performance indicators (KPIs). These KPIs may vary according to the retailer’s specificities, but they generally include elements such as profit margin, sales volume, conversion rates, average basket, price indexes versus competitors, price elasticity, among others.
The reporting module provides a clear view of these KPIs, and offers the possibility of customizing dashboards according to the indicators you wish to monitor closely. Monitoring these KPIs is essential to understanding the performance of your pricing strategy, identifying opportunities and risks, and making informed decisions to optimize your prices in line with business objectives.
FAQ 4: How does XPA facilitate collaboration and information sharing across the enterprise?
XPA promotes transparent communication and effective collaboration within the company. The generated reports can be shared with various stakeholders, such as pricing, category management, marketing, IT teams, and management.
By providing each stakeholder with the relevant information they need, XPA ensures that everyone is on the same page and that decisions are made based on the most current and relevant data.
FAQ 5: What are the main advantages of dynamic data integration compared to manual updating?
Dynamic data integration ensures real-time information updates. This means you always have access to the latest data without waiting for manual updates or processing delays. This speed allows for more responsive decision-making, based on current information. Additionally, this eliminates potential human errors associated with manual updates and ensures data consistency at all times.
FAQ 6: How does the integration with third-party Business Intelligence tools work? What types of data can be imported?
Our retail software reporting solution is designed to integrate seamlessly with third-party business intelligence tools. You can import a multitude of data from external sources, such as elasticity coefficients, product attributes, product sheets, VAT and tax information, and many others. This integration enriches your reporting, providing a more complete view of your pricing activities, enabling deeper analysis and informed decisions.
FAQ 7: How can dashboards be customized to meet the specific needs of my business?
XPA’s retail software reporting module offers great flexibility in creating dashboards. You have the possibility to personalize the formulas, shapes and vocabulary used. Additionally, you can adjust the dashboards based on the metrics you want to monitor closely.
This allows you to create dashboards that accurately reflect your needs and priorities, ensuring you always have access to the most relevant information for your business.
Want to optimize your pricing strategy?
optimiX supports you from start to finish:
Price monitoring via in-store and/or online price surveys – Matching & Linking of your products with respect to range consistency – Unlimited creation of pricing rules – Elasticity & AI calculations – Sales simulations & Dashboards – Change management
Unlimited creation of pricing rules – Elasticity & AI calculations – Sales simulations & Dashboards – Change management
