

The sales index is a key performance indicator that measures the sales momentum of a product or category. It compares actual sales with a reference level (forecasts, historical average or set targets) to assess whether performance is in line with, above or below expectations.
This indicator enables companies to optimize inventory managementfine-tune their demand forecasts, and improve profitability by quickly identifying discrepancies between observed results and targets.
In this article, we take an in-depth look at this indicator, its calculation, interpretation, measurement tools, best practices, limitations and how specialized solutions such as XFR-Optimix Forecast & Replenishment can transform it into a performance indicator.
What is the Sales Index?
The sales index is a ratio that measures a product’s sales performance against a benchmark, usually forecasts or historical average sales. It is calculated as follows: 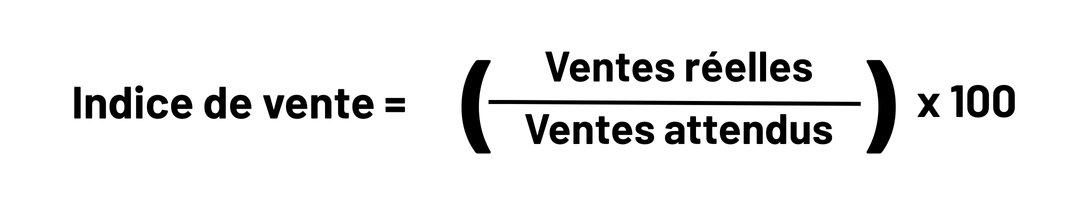
- An index above 100 indicates outperformance.
- An index below 100 indicates underperformance.
- An index of 100 means that sales are in line with expectations.
Practical example
Suppose a product has expected sales of 500 units over a given period, but actual sales are 600 units. The sales index will be 120, indicating a performance 20% above expectations.
Why is the Sales Index Crucial?
Inventory & Stock Level Optimization
The sales index enables stock levels to be adjusted in line with actual demand. Better inventory control reduces the risk of stock-outs and overstocking, while optimizing storage space and financial resources.
Improved Demand Forecasting
Regular analysis of sales indices provides reliable information for adjusting demand forecasts. This enables companies to plan production and supplies more effectively.
Cost reduction
Efficient use of the sales index helps to reduce the costs associated with inventory management, losses due to unsold products and stock-outs, thus improving overall profitability.
Sales Performance Management
The Sales Index provides visibility on the performance of products and sales teams. It helps identify under-performing products, promotional opportunities and market trends.

How to calculate the Sales Index?
Calculation methods
The sales index can be calculated in different ways, depending on the level of analysis required:
- By product: compare a product’s actual sales with its expected sales.
- By category: evaluate the performance of an entire category to detect global trends.
- By sales outlet or channel: analyze performance by store or sales platform.
Calculation example
If a product has expected sales of 800 units and actual sales are 950 units, the sales index is 118.75, indicating an outperformance of almost 19%.
Interpreting Sales Indices
The sales index provides a simple but powerful measure for assessing a product’s sales performance. When the index equals 100, it means that sales are exactly in line with forecasts. An index above 100 indicates that the product is exceeding expectations, while an index below 100 indicates underperformance.
To get the most out of this indicator, it’s crucial to analyze indices in the context of periods, promotions and market trends. For example, a high index during a one-off promotion may be normal, while a low index during a period of high demand may require strategic adjustments. Interpretation must combine index values with operational and marketing information to obtain a complete, actionable picture for decision-making.

Tools and Methods for Calculating the Sales Index
Excel or Google Sheet spreadsheets
Excel or Google Sheets allow you to quickly calculate the sales index, perform ad hoc analyses and create simple graphs to visualize performance.
Business Intelligence (BI) software
Business Intelligence (BI) software enables sales data to be centralized and visualized, enabling real-time monitoring of sales trends and performance indicators. Thanks to interactive dashboards and automated reports, teams can quickly identify deviations from forecasts and detect emerging trends.
By combining these tools with specialized forecasting solutions, companies gain in accuracy and responsiveness, optimizing sales and inventory management.
Specialized Solutions: Optimix Forecast & Replenishment (XFR)
XFR – Optimix Forecast & Replenishment is an advanced solution that combines artificial intelligence and machine learning to improve the accuracy of sales forecasts and inventory management. It enables sales to be analyzed at different levels, including individual stores, making it possible to track store sales index and detect local trends.
Key features include:
- Process automation: data collection, processing and analysis without manual intervention.
- Multi-level optimization: automatic adjustment of forecasts and replenishments according to stores, warehouses and product lines.
- Advanced predictive analysis: identification of trends, seasonal cycles and customer behavior to accurately anticipate demand.
By integrating the store sales index into its analyses, XFR enables rapid detection of discrepancies between outlets, adapting stocks and replenishments to each store, and improving supply chain responsiveness. This transforms sales data into concrete decisions, reducing out-of-stocks, limiting overstocks and optimizing the commercial performance of each outlet.
Best practices for using the Sales Index
The sales index is a powerful strategic tool, but for it to add real value, it’s essential to adopt certain best practices. These not only improve the accuracy of analysis, but also help to transform data into effective operational and strategic decisions.
Regular monitoring and updating of data
Frequent updating of sales data is crucial to ensure that the index reflects market reality. Weekly or monthly readings enable you to detect discrepancies quickly and adjust sales, logistics and marketing actions accordingly.
Background and comparative analysis
The sales index must always be interpreted in context. Comparing results with similar periods, initial forecasts or indices for other products helps to understand fluctuations and identify influential factors.
Integration with other key indicators
For a complete picture, the sales index needs to be analyzed in conjunction with KPIs such as inventory turnover, margin per product, customer satisfaction or returns volumes. This approach enables us to correct biases and steer decisions towards high value-added actions.
Segmentation by product, channel and region
Segmenting the sales index according to different criteria (product type, distribution channel, geographic region) enables us to identify specific trends and implement targeted actions. This granularity improves responsiveness and optimizes inventory and supply management.
Short- and long-term trend analysis
The sales index should be used to identify both immediate trends and long-term developments. Short-term trends enable operations to be adjusted quickly, while long-term trends help to guide sales strategy and investment planning.
Automation and specialized solutions
The use of specialized solutions such as Optimix Forecast & Replenishment (XFR) can automate index calculation, generate dynamic reports and simulate different sales scenarios. These tools improve accuracy, reduce manual errors and enable teams to focus on strategic analysis rather than data processing.
Inter-team collaboration
Effective sales index monitoring requires collaboration between sales, marketing, logistics and finance teams. This coordination ensures that corrective or strategic actions are aligned with market reality and company objectives.
By applying these best practices, companies can make the most of the sales index, transforming this indicator into a genuine sales and operational performance lever.
Sales index limits
Although the sales index is a powerful tool for steering sales performance, it does have certain limitations which it is important to be aware of to avoid misinterpretation and maximize its strategic value.
Dependence on data quality
The sales index is based on reliable and complete data. Errors in recorded sales, missing data or incorrect initial forecasts can distort the results. Poor data quality results in misleading indices, which can lead to inappropriate decisions concerning inventories, production or marketing campaigns.
Sensitivity to external factors
Certain unforeseen events may temporarily influence the sales index, such as exceptional weather conditions, regulatory changes, logistical problems or economic fluctuations. These factors may cause actual sales to differ from forecasts, without reflecting the intrinsic performance of the product.
Interpretation requires context
The sales index alone is not enough to assess overall performance. It must be interpreted in the context of seasonality, promotions, marketing campaigns and market trends. Without this context, a low or high index may be misunderstood, leading to inappropriate adjustments in inventory management or sales decisions.
Forecast limits
The index compares actual sales with forecast or average sales. If initial forecasts are imprecise or based on incorrect assumptions, the index loses its relevance. It is therefore crucial to combine the sales index with reliable forecasting methods and regular adjustments to maintain its value.
Additional use required
To obtain a complete and operational vision, the sales index must be analyzed in conjunction with other key indicators, such as inventory turnover, margin per product, customer satisfaction levels or return volumes. This multi-indicator approach makes it possible to correct biases and take more strategic decisions.
By knowing these limits, companies can use the sales index in a more enlightened way, maximizing its benefits while minimizing the risks associated with misinterpretation.
Long-term trend analysis
By analyzing sales indices over the long term, we can identify lasting trends and anticipate consumer behavior well beyond seasonal fluctuations. By observing monthly or annual variations, companies can detect recurring patterns, such as demand peaks linked to certain periods of the year, product renewal cycles or changes in customer preferences.
It also enables us to prepare proactive strategies. For example, a product whose sales index rises steadily over several quarters may justify an increase in production, targeted marketing investments or a range extension. Conversely, a product with a steadily declining index may require corrective action, such as revising positioning, adapting the offer or planning specific promotions.
Long-term analysis also facilitates strategic decision-making concerning expansion into new markets, innovative product launches or supply chain adjustments. By integrating these trends into planning processes, companies gain agility and can react more quickly to market developments, reducing financial risks and maximizing growth opportunities.
Finally, tracking long-term trends contributes to organizational learning: by documenting and analyzing past performance, sales and operational teams have a reliable track record to guide future decisions, improve forecasting and strengthen the company’s overall competitiveness.
Correlation with other key indicators
The sales index provides valuable information on sales performance, but its value is increased tenfold when analyzed in combination with other key performance indicators (KPIs). This correlation provides a more comprehensive and strategic view of the company and its products.
Stock turnover rate
The inventory turnover rate measures the speed at which products are sold and replaced over a given period. By cross-referencing this indicator with the sales index, it is possible to detect products in high demand but with limited stock, as well as those selling slowly despite a high forecast. This analysis helps to adjust stock levels and improve supply chain efficiency.
Gross margin by product
The sales index may reveal a high volume of sales, but without taking profitability into account, the information remains incomplete. By correlating the index with gross margin, companies can identify the products that really contribute to profitability, and prioritize resources and marketing efforts on the most profitable products.
Customer satisfaction indicators
Customer satisfaction is a critical KPI for measuring service quality and product availability. A correlation between sales index and satisfaction indicators enables us to understand whether sales performance also translates into a positive customer experience. This helps identify friction points, such as out-of-stock situations or extended delivery times.
Multi-dimensional analysis
Cross-referencing the sales index with different KPIs enables multi-dimensional analysis. For example, comparing the sales index with the rate of return, customer loyalty or the online conversion rate enables you to identify levers for improvement and make informed decisions on merchandising, production and marketing.
Strategic decision-making
By integrating these correlations into decision-making processes, companies can prioritize high-impact actions, adjust promotional campaigns, optimize supplies and steer growth with greater precision. The sales index thus becomes a central tool in a comprehensive dashboard, guiding both operational and sales strategy.
Anticipating market fluctuations
By monitoring sales indices, it is possible to quickly detect the emergence of new trends, changes in consumer behavior, or the need to adjust production and logistics. This ability to anticipate enhances the company’s responsiveness, enabling it to react before deviations become problematic, thus minimizing stock-outs and lost sales.
In addition, regular analysis of local indices and trends provides a better understanding of seasonal cycles and the specific behavior of each market segment. This enables us to plan supplies and promotions more accurately, adapt marketing campaigns and support long-term strategic decision-making.
The use of advanced tools reinforces this capability by integrating artificial intelligence and machine learning to detect complex patterns, accurately anticipate fluctuations and continuously optimize the supply chain. In this way, the company remains agile, able to seize market opportunities and maintain optimum service levels.

Dynamic Forecasting and Continuous Adjustment
Dynamic forecasting means regularly adjusting forecasts in line with new data, whether actual sales, customer behavior, market trends or external events. This enables companies to remain responsive to fluctuations in demand and avoid the errors associated with static forecasts.
Continuous monitoring of sales indices and other key indicators enables us to quickly identify discrepancies between forecasts and actual sales. These discrepancies can reveal changes in trends, unexpected seasonal effects, or the impact of promotions and marketing campaigns. By correcting forecasts in real time, companies can improve product availability, reduce overstocking and minimize stock-outs, while optimizing operational resources.
Ongoing adjustments are not limited to revising forecast quantities. They also include optimizing forecast horizons, reallocating stocks between sales outlets or warehouses, and updating production and supply plans. This flexibility ensures better adaptation to variations in demand, and strengthens the overall performance of the supply chain.
What’s more, modern forecasting tools, such as XFR- Optimix Forecast & Replenishment, incorporate machine learning models capable of continuous learning. These algorithms analyze historical and current data to progressively improve forecast accuracy, detecting complex correlations and patterns not visible at first glance. Automating these calculations saves teams time, enabling them to focus on strategic analysis rather than manual data processing.
By combining dynamic forecasting and continuous adjustment, companies can anticipate market needs more effectively, make informed decisions and maintain optimum service levels, while strengthening their competitiveness and resilience in the face of economic and commercial variations.
Conclusion The sales index, a key indicator
Often perceived as a simple sales indicator, the sales index actually plays a central role in overall company management. It enables precise management of inventory levels, refines demand forecasts and supports profitability. Regular monitoring provides invaluable insight into market dynamics, facilitates the identification of lasting trends, and enables operations to be adjusted in real time for greater agility.
The sales index becomes not just a tracking tool, but a true performance indicator that, when combined with other KPIs and rigorous analysis, can transform the way a company understands and responds to customer demand.