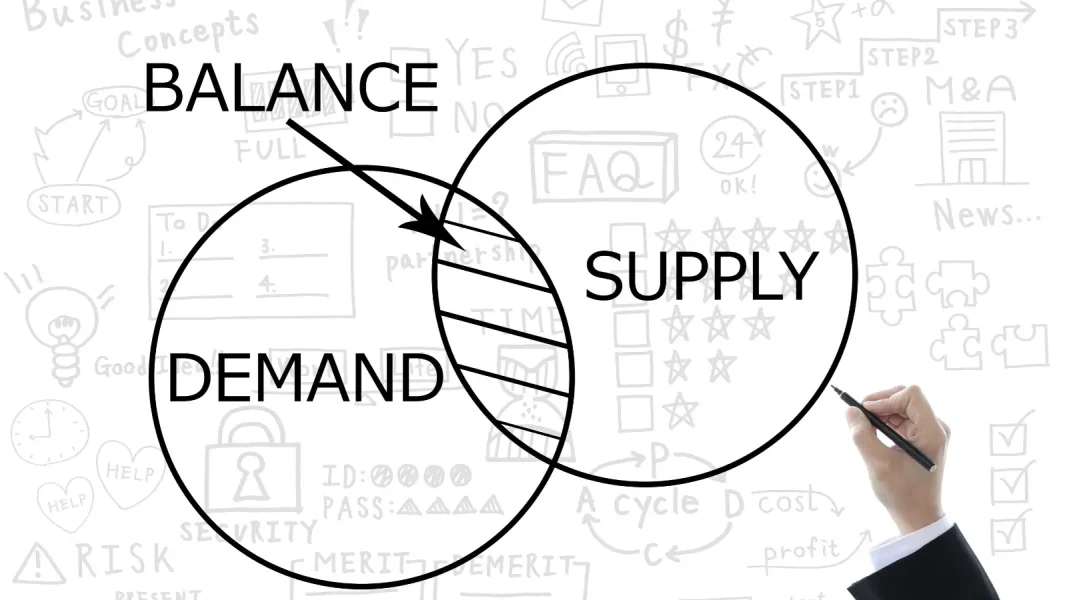

Failure to accurately forecast demand can quickly lead to costly consequences for the company. An underestimated forecast increases the risk of stockouts and lost sales. Conversely, an overestimated forecast can lead to excess inventory, tie up capital, and increase storage or markdown costs.
The Demand Planning Process enables better anticipation of these situations by structuring the demand forecasting process step by step. It relies on data consolidation, the creation of a baseline forecast, the integration of business information, the analysis of uncertainties, and the validation of a plan agreed upon by all teams.
Once approved, this plan serves as a reference for planning procurement, adjusting inventory levels, anticipating capacity needs, and coordinating sales and supply chain decisions. Actual results are then compared with forecasts to identify variances and improve the next cycle.
The quality of planning therefore depends on the entire workflow: data reliability, choice of forecasting methods, collaboration among teams, validation rules, and monitoring of results. Here’s how to organize each of these steps in practice.
What are the steps in a demand planning process?
A robust process is based on a series of interconnected steps. The final quality rarely depends on a single model. It results primarily from the consistency of the entire process, from the source data to the operational decision.
The cycle begins with the preparation of information and continues with the development of a baseline forecast. The teams then refine this forecast, assess risks, and validate assumptions. After the plan is shared with the relevant departments, they analyze variances to improve the next cycle.
Consolidate and ensure the reliability of the data
The data needed for demand planning is often scattered across ERP systems, point-of-sale systems, inventory management tools, e-commerce platforms, and promotional software. Consolidating this data makes it possible to cross-reference sales with availability, prices, sales promotions, and events that may influence demand.
This process involves handling missing data, duplicates, returns, and changes in coding. It also requires consistent data repositories. When a product changes packaging or identifier, its history must remain usable, provided that the differences between the old and new product codes are taken into account.
Handling data gaps requires special attention. A period with no sales may indicate a lack of demand, but it may also indicate unavailability. Inventory data, unfilled orders, or the performance of comparable products can help interpret this situation. Lost demand, however, remains an estimate, and the assumptions underlying it must be documented.
The choice of granularity then plays a decisive role. A monthly national forecast can mask significant variations between stores or weeks. An excessively detailed level can produce data series that are too irregular. The appropriate level depends on the decisions to be made, with the ability to aggregate or break down the results in a consistent manner.
Building a baseline forecast
Once the data has been prepared, forecasting methods can be used to identify trends, seasonality, and sales patterns. A stable product, an item sold only occasionally, and a highly seasonal item do not necessarily require the same approach.
The choice of model must therefore vary depending on the characteristics of each series. Automation makes it easier to compare multiple methods and reassess choices as demand changes. It allows teams to devote more time to situations that require business analysis.
Performance must be evaluated over periods that were not used to build the model. A test conducted over several consecutive dates allows us to verify how the method would have predicted sales using only the information available on each date. This validation must correspond to the time horizon actually used for decision-making.
The baseline forecast, sometimes called baseline, serves as the starting point for the group’s work. Depending on the selected settings, it may already include certain known factors. It is therefore necessary to specify what it contains before adding a promotional or pricing effect, so as to avoid counting the same influence twice.

Enhance the forecast with business insights
The sales, marketing, purchasing, and supply chain teams have information that models cannot always deduce on their own. They are aware of upcoming campaigns, price changes, new products, changes to the product lineup, and the specific needs of certain customers.
These contributions must be structured. Manual corrections made without justification, without a defined duration, and without follow-up can undermine the forecast. Each adjustment should specify the event in question, its estimated impact, the affected benchmarks, and the time horizon to which it applies.
For a promotion, the analysis may focus, in particular, on the discount level, the visibility of the offer, and the results of comparable promotions. It must also take into account deferred purchases: an increase in sales of one product may be accompanied by a decrease in sales of a substitute product or a slowdown in sales after the promotion.
Collaboration thus facilitates the comparison of data with on-the-ground knowledge. Disagreements should focus on explicit hypotheses. After the event, comparing the predicted effect with the observed effect makes it possible to determine whether the adjustment was appropriate and to improve future estimates.
Developing Scenarios and Measuring Uncertainty
A forecast average isn’t always enough to make a decision. Two products may show the same expected volume but have very different levels of uncertainty. One is driven by stable demand; the other depends heavily on the weather or the success of a sales campaign.
Demand Planning allows you to develop central, high, and low scenarios. Each scenario must be based on plausible assumptions: lower foot traffic, a more successful promotion, or a delayed launch. Their value lies in the consequences they allow you to examine.
Teams can then assess inventory risks, capacity needs, or the volumes likely to remain at the end of the season. They also identify the indicators that would warrant a revision of the plan and the possible actions to take if demand deviates from expectations.
A scenario differs from a forecast interval. The former explores a combination of assumptions; the latter describes a range of values associated with a model’s uncertainty. The two approaches can complement each other, provided their meanings are clearly explained to decision-makers.
Approve the plan and forward it to the operational teams
Validation transforms estimates into a common reference point. It should make it possible to determine which volumes were selected, for which periods, and based on which assumptions. Points that are still uncertain should remain visible, rather than being hidden behind a figure presented as final.
The approved plan is then used to guide the planning of procurement, production, and distribution. These departments review demand in light of available inventory, outstanding orders, lead times, and capacity.
It is helpful to keep the estimated demand and the volumes the company can actually supply separate. A supplier issue does not automatically reduce customer demand. Maintaining this distinction makes it possible to assess the potential shortfall and determine an appropriate response.
Finally, sharing the plan requires clear version control. Teams must work from an identifiable reference, know its approval date, and understand the changes made since the previous cycle.
Track results and learn from discrepancies
The accuracy of forecasts must be measured over time, at the level relevant to decision-making. Error indicates the magnitude of the discrepancies between what was forecast and what actually occurred. Bias reveals a persistent tendency to overestimate or underestimate demand.
An overall average can mask significant issues. Overestimates and underestimates may cancel each other out as some SKUs accumulate inventory while others become unavailable. The analysis must therefore be able to drill down by product, product family, channel, or location.
Discrepancies should also be prioritized based on their economic impact. A minor error involving a strategic item may require more attention than a significant discrepancy involving a low-value item.
Monitoring is primarily used to explain significant differences: an event that was not properly anticipated, incorrect data, excessive adjustments, or changes in behavior. These insights help refine data preparation rules, models, and business inputs.
What are the inputs and outputs of demand planning?
A demand planning process transforms multiple sources of information into a demand plan that operational teams can use. The quality of the result therefore depends on the available data, its reliability, and how it is integrated into the forecasting cycle.
Key input data may include sales and order histories, inventory levels and stockouts, prices and promotions, product launches or discontinuations, changes to the product mix, and market information that may influence demand.
In addition to this internal data, external factors may be taken into account when their impact is significant: seasonality, the calendar, weather, local events, or market trends.
This information is first used to generate the baseline forecast. Teams can then enhance it with future events that are already known, such as a promotional campaign, the launch of a new sales channel, or expected changes regarding a key customer.
The main deliverable of the process is the approved demand plan. It outlines expected volumes at the level of detail relevant to the company: product, product family, site, channel, geographic region, or time period.
This plan must also include the key assumptions that account for significant changes, as well as the risks or scenarios identified when there is significant uncertainty. It can then serve as a reference for procurement, production, distribution, and other planning processes.
Keeping the baseline forecast, business adjustments, and the final approved version separate finally makes it possible to understand how the plan has evolved and to measure the contribution of the various stages of the process.

What methods should be used to forecast demand?
Forecasting methods should be selected based on the available data, product behavior, and the decision horizon. Their complexity alone is not an indication of quality.
Time-series-based approaches analyze past sales trends. A moving average can serve as a benchmark for relatively stable demand. Exponential smoothing assigns greater weight to recent observations and, depending on its form, can account for a trend or seasonality.
Other methods seek to explain demand based on variables such as prices, promotions, or weather conditions. They thus allow for a better integration of the factors that influence demand. Machine learning approaches can analyze more complex relationships among these factors. However, their use requires sufficiently reliable data and the availability of the necessary variables over the forecast period.
For intermittent sales, it is important to take into account the many periods with no sales. For a new product launch, the lack of historical data means that other information must be used: comparable products, product features, planned distribution, or test results.
A simple method should always serve as a benchmark. It allows us to verify whether a more sophisticated approach yields a real improvement. The final decision is based on tests tailored to the decisions at hand and on the teams’ ability to understand the results.
Who is involved in the process, and how often?
The Demand Planner typically coordinates the forecasting process. He or she prepares analyses, reviews the results, organizes input from business units, and ensures the plan is consistent. He or she is also responsible for making the assumptions and risks easy to understand.
Sales representatives provide information on customers and upcoming transactions. The marketing team details campaigns, product launches, and changes to the product lineup. The procurement and supply chain teams report on changes in availability that may affect actual sales. The finance team puts forecasts into perspective relative to financial goals.
This type of organization requires clear lines of responsibility. It is important to know who prepares the data, who proposes an adjustment, who approves it, and who resolves disagreements. A meeting is useful when it helps resolve specific issues and make decisions.
The frequency depends on the company’s needs. A monthly review can help structure the team’s work, with weekly or daily updates on sensitive products. Technical recalculations may occur frequently without requiring a meeting for every update.
The time horizon must cover the time needed to take action. A company facing long supplier lead times must plan for its commitments well in advance. Short-term decisions require greater detail, while longer-term outlooks can be examined at an aggregate level.
How do you organize a demand planning cycle?
In a monthly cycle, the process may begin with closing out the data from the previous period and updating the statistical forecast. The Demand Planner then analyzes the key variances and identifies the SKUs that require special attention.
The sales and marketing teams then provide new information: promotions, product launches, developments involving a key customer, price changes, or changes to the product lineup. These events are translated into measurable assumptions before being incorporated into the plan.
A review of the request then allows for a comparison of the baseline forecast, the proposed adjustments, and the identified risks. The goal is not to comment on all the baseline figures, but to focus the discussion on significant variances and decisions that require resolution.
At the conclusion of this review, a version of the plan is approved and dated. This version serves as the reference document for other planning processes until the next cycle, unless an event significant enough to warrant an interim revision occurs.
The schedule must specify the dates for data availability, team contributions, plan approval, and transmission to operational departments. This approach prevents outdated information or different versions of the forecast from circulating simultaneously.
Example: How do you plan a promotion using demand planning?
Let’s take the example of a retailer planning a two-week promotion on a line of food products. The process begins with an analysis of typical sales, seasonality, and previous promotions. Periods of low sales are identified so that limited sales are not misinterpreted as a lack of customer interest.
A baseline forecast is then calculated for the stores in question. The marketing department specifies the discount, the promotional materials, and the duration of the promotion. The sales teams provide local information that could affect the results.
Assumptions are examined at the household level. If customers can substitute one product for another, the expected increase in sales of the promoted item must be compared with sales of substitute items.
The teams then compare several scenarios. If demand exceeds expectations, an additional shipment may be necessary. If demand is lower than expected, the company may be left with inventory that is difficult to sell, especially for products with a short shelf life.
The approved plan is sent to the procurement team, which calculates requirements based on inventory levels and expected shipments. During the promotion, sales are monitored to identify discrepancies. After the promotion, the analysis also examines remaining inventory levels and sales trends in the following weeks.
At the end of the cycle, the selected assumptions, the approved version of the plan, and the associated decisions are recorded. They can be compared with actual sales data after the transaction to distinguish between a model error, an incorrect business assumption, or an unforeseen event.
How do you structure and implement a demand planning process?
The first step is to identify the decisions that the process is intended to improve. Preparing for a season, reducing stockouts on priority items, or ensuring the reliability of long-lead-time purchases do not all require exactly the same scope.
A data audit is then conducted to identify the available information and any necessary corrections. It must examine the depth of historical data, the quality of the data repositories, and visibility into promotions or availability.
A pilot scope facilitates implementation. It can combine multiple request profiles to test data preparation, methods, adjustments, and plan transmission. The results obtained are used to stabilize operations before scaling up.
The choice of forecasting software should be based on these needs. A suitable tool should facilitate data consolidation, model comparison, collaboration, and version tracking. Its value also depends on its integration with the systems used for decision-making and execution.
Optimix’s Forecast & Replenishment solution offers, among other features, calculations at the product-site level, consideration of promotions and external factors, and a library of more than 60 statistical and artificial intelligence models. These capabilities can support forecasting efforts, with configurations tailored to the company’s needs.
Before scaling up the process, it is helpful to establish a few common rules: the forecasting level used for each decision, the cycle schedule, the responsibilities of contributors, the conditions under which manual adjustments are permitted, and the validation procedure. This makes the process reproducible and less dependent on individual habits.
Improving the reliability of the demand planning process over time
An effective demand planning process is not limited to producing a forecast. It establishes a continuous cycle in which data, models, and business insights are analyzed together to produce a shared, actionable plan.
Its robustness depends on the reliability of the data, clear lines of responsibility, traceability of assumptions, and regular analysis of variances. As cycles unfold, these insights make it possible to refine forecasts and make earlier decisions regarding inventory, procurement, and capacity.
The challenge, therefore, is less about seeking a perfect forecast than about building a process that is structured enough to detect discrepancies, revise assumptions, and gradually improve the quality of decisions.